Data management
Once the query from the data base is completed, the results can be managed in different ways. You can:
- Change the order of the columns in the results table
- Specify the context that are displayed for each matched token
- Specify stopwords that are filtered out from the results
- Split the results into data groups, apply functions to each group, and merge the groups again
- Transform the results table into another type of table
- Apply summary functions and filters that remove matches from the results
You can also apply user functions to each column in the results table.
The data management toolbox in the upper right corner of the main screen provides access to most of these features.
Feature order
TO BE ADDED
Context
The Context toolbox is used to specify how much context to the left and to the right of the matched token should be displayed. The two controls Left: and Right: indicate the number of words in the left and in the right context. The value of these settings is also used by the Collocation list transformation described below.
This toolbox also controls how the context is shown:
- Columns: Each word in the context is shown in a separate column in the results table. This view has the advantage that you can sort the tokens in the query by words in the context.
- KWIC: All words from the left context are shown in one column in the results table, and all words from the right coontext are shown in another. This view resembles the display of traditional concordancers.
- Single string: The whole context as well as the matched token are shown in a single column. The words that are a part of the match are shown in capital letters so that they are easier to spot in the context.
If the current corpus contains information about sentence boundaries (e.g. the BNC), the context can be restricted to sentences by checking the box Restrict to sentences. If the contexts are restricted in this way, the number of words that are shown can be smaller than the number of words selected by the Left: and Right: controls if the sentence is shorter than these values.
Retrieving contexts can take some time. If you do not want to include the contexts in your results table, choose No context.
Stopwords
TO BE ADDED
Data groups
The matched tokens can be temporarily split into data groups so that all matches in each group have the same value in one or more of their columns. For example, data groups may be specified by using the part-of-speech column. In that case, all tokens in the groups share the same part-of-speech tag. If the file name column is also added, each part-of-speech tag group is further subdivided into matches from the same files.
Only those columns can be used for data groups that are included in the data table. This includes functions and columns that are produced by data transformations.
For each data group, a set of group functions can be specified. These functions consider only the matches that are contained in each group, and ignore the matches in all other groups.
By using group functions, it is for instance easy to obtain the type-token ratio for different files in a corpus. In order to do so, use the query string * to match all tokens in the corpus (which may take a while with larger corpora). Select Word and Filename (if available) as output features, and press New query.
Now, specify a new data group by pressing the New button in the Data groups toolbox. The Data group dialog will appear. In this dialog, select the column Filename as the only grouping column. Scroll down in the list of group functions until you find the Type-token ratio function. Press the Change columns button, and select the Word column. If the data management is applied, there will be a new column TTR(Word by Filename) which shows the type-token ratio in each file.
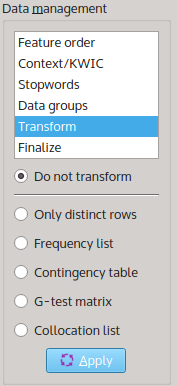
Transformations
Only distinct rows
This transformation discards all doublets, i.e. each row that has the same values in its columns as a previous row.
Frequency list
The frequency list shows the number of occurrences of the values in the results table. If you want to exclude one of the columns from the frequency count, you can hide that column by right-clicking column header, and selecting “Hide column” from the context menu.
Contingency table
A contingcy tables is a restructured feature list. The last entry in the feature order toolbox is the variable that defines the shape of the contingency table. Each value of that variable forms a separate column in the table. The contingency table also shows row and column totals.
Currently, the behavior of numeric values is undefined.
G-test matrix
The G-test matrix takes the results table and applies pairwise log-likelihood tests to determine which results occur with statistically different frequencies in the current corpus. The figure shown in the matrix is the G statistic. Colors in the matrix indicate a statistically significant value. A red cell indicates that the result in the row is significantly more frequent than the result in the column.
Depending on the number of value combinations, the test matrix can become relatively large, and therefore, many multiple comparisons can be performed. To correct for an inflation of significant test results, a corrected alpha value is determined using the False Discovery Rate method (Benjamini & Hochberg 1995, described in Narum 2006).
If there are corpus features in the results table, these features are used to construct subcorpora. In this way, it is easy to compare for instance the number of tokens between female and male speakers, or between different files.
If you click on a cell in the G-test matrix, the Independence test viewer opens. This dialog shows a contingency table, and calculates the corresponding log-likelihood test and Chi-square test. It also estimates the effect size by displaying the odds ratio and Cramer’s phi. The dialog offers buttons to copy the content of the dialog to the clipboard, either as HTML, LaTeX, or als plain text.
Warning: The G-test matrix is still a somewhat experimental feature. If you wish to report the results of the involved statistical tests in a scientific publication, you are strongly advised to check their validity first.
Collocation list
‘Collocations’ determines words that frequently co-occur with the words from the query strings. The span of words to the left and to the right that are considered for the collocation list is defined in the Context toolbox.